| INTRODUCTION | BACKGROUND | TECHNOLOGIES | CASE STUDY | E&R ANALSIS TOOL | SUMMARY | THE TEAM |

SUMMARY Contents >
|
Case Study Results |
|
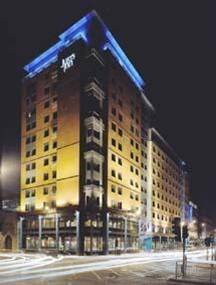
Jury’s Inn Conclusions: We were able to test the tool using consumption data given to us by the Jury’s Inn Hotel using the Benchmarking, Regression and CUSUM analysis parts of our tool. Some of the results and conclusions we have made are as follows: Benchmarking The benchmarking analysis was carried out using the tool we created in order to compare the energy performance of the Jury’s Inn building to set UK energy performance standards. These standards are set by the Carbon Trust and specify that the energy consumption is calculated and normalized based on the climate data for the building location (the benchmarking standards can be found in our website). The original energy performance measurements received by the hotel did not have this factor taken into account; and so their performance rating was not completely accurate. We were fortunate enough to be given annual utility reports for the whole of the Jury’s Inn chain in the UK. These reports included the energy and resource consumption i.e. Electricity, Gas and Water, for each hotel, and the performance rating that each hotel had been given. We used the data provided to calculate the normalized performance indicators for the hotels in the chain for Electricity and Gas, and found that some of the initial hotel ratings changed. The hotels are classed Good, Fair or Poor. Some of our results showed hotels falling from a Fair rating to a Poor rating, and others from Good to Fair. Jury’s Inn Glasgow however managed to remain in the Good category of the standards, even after the data was normalised; which is a result indicative of all of the energy saving methods they have introduced to their building. Additional normalised performance calculations were carried out using the sleeper and occupancy data we received from Jury’s Inn. Again the Glasgow hotel was performing better then its counterparts. Those results were for Electricity and Gas, unfortunately the same story could not be told for water consumption in the Glasgow hotel. Hotels are massive consumers of energy and resources as a result of high occupancy levels. All of the hotels were rated Poor when they were analysed for water; as the standards for water consumption are very stringent. However the newer Jury’s Inn hotels performed better than the older buildings as a result of new water saving methods being installed during their construction. Jury’s Inn Glasgow was rated just below these hotels as it was older and does not have the same infrastructure in place, accounting for the only slightly higher consumption. An average consumption was calculated for Electricity, Gas and Water for all of the hotels in the chain. These values were compared to the actual consumption levels of each hotel and a percentage difference was calculated. This further highlighted the better consumption performance of the Jury’s Inn hotel in Glasgow. This is again the result of a more conscious approach to controlling and reducing energy and resource usage being adopted by the hotel staff. Regression Analysis The regression analysis component of the tool allows the hotel user to view the energy performance of the building graphically; based on the strength of a relationship between their energy and resource consumption and another variable e.g. climate, occupancy. We provide the hotel owner with the opportunity to carry out multiple variable regressions so that better results can be found to explain the use of energy and resources. The analysis we carried out found some strong relationships between Electricity and Degree Day data; and in addition to this result, the multiple variable regressions produced results with R2 values of ~0.75. These results were used as part of the next step in the tool analysis, which was CUSUM analysis. CUSUM Analysis The CUSUM graphs plotted using the regression equation found, were able to confirm some of the points where energy saving methods were introduced to the building. For the regression done on Electricity consumption we found changes in performance after light control sensors were installed; and also when timers were introduced to the fridges. This outcome confirmed that our tool was useful in identify the effect of energy saving changes made and that the monitoring process could be carried on in the future. To help the hotel make predictions for future consumption, further regressions were carried out. The data used in these regressions was relevant to a linear slope in the CUSUM graph plotted. A multiple regression was done using electricity data for the last 9 months of 2007, and came up with a regression equation that could be used to predict consumption in 2008. The results found from this equation were compared to the actual consumption of the hotel in the first three months of 2008. We found a significant difference in consumption for January and March but our prediction was fairly similar for February. The difference in consumption is a result of a variable that was not included in the regression. For example a window could have been left open in the building or the standard of the staff good energy practice could be falling. Overall though the analysis carried out for Jury’s Inn has highlighted the benefits of investing in energy saving technologies; and that the impact is noticeable as well as quantifiable. For a business aiming reduce their energy consumption and impact on the environment, in addition to making a profit and keeping customers satisfied, Jury’s Inn are heading in the right direction. Further savings are possible and their performance can only improve if they initiate and maintain the use of the energy monitoring and analysis tool provided by this project. |